


Reporting is a daily occurrence for team leads. It is needed for the presentation of the results and optimization of department workflows, but it also takes a lot of time and can be a difficult process.
ServiceNow is a useful tool for generating reports; it demonstrates processes and results in a clear visual form that helps managers to draw the necessary conclusions.
Let’s consider the ServiceNow platform in detail, including its possibilities, out-of-the-box tools, and peculiarities of working.
What reporting does ServiceNow have OOTB?
With the help of ServiceNow inbuilt reporting, an IT manager can find information regarding several general spheres:
- key performance indicators (KPIs) and SLAs,
- resolution of incidents and problems,
- service desk research (technical competencies, experience assessment, etc.),
- knowledge database usage stats (page views, popular posts, etc. ),
- information about contracts, configuration, changes, and requests.
This general information can be sufficient for some companies. Yet, if a company needs specific data, they can always make a custom report themselves.
How to create a custom report in ServiceNow?
With the help of the built-in reporting tools, either Report Builder or Report Designer, a manager can create the needed custom reports. Both these constructors build reports almost the same way.
Report Builder demonstrates a lot of functions in a single panel, and Report Designer presents different tabs for the selection of the data source, configuration, report type, and document style. With Report Designer, a manager also can customize a report, preview it, and share it with others using Share panel. Also, Report Designer can work with imported data and MetricBase Time Series.
This is an example, how Report Builder looks like.
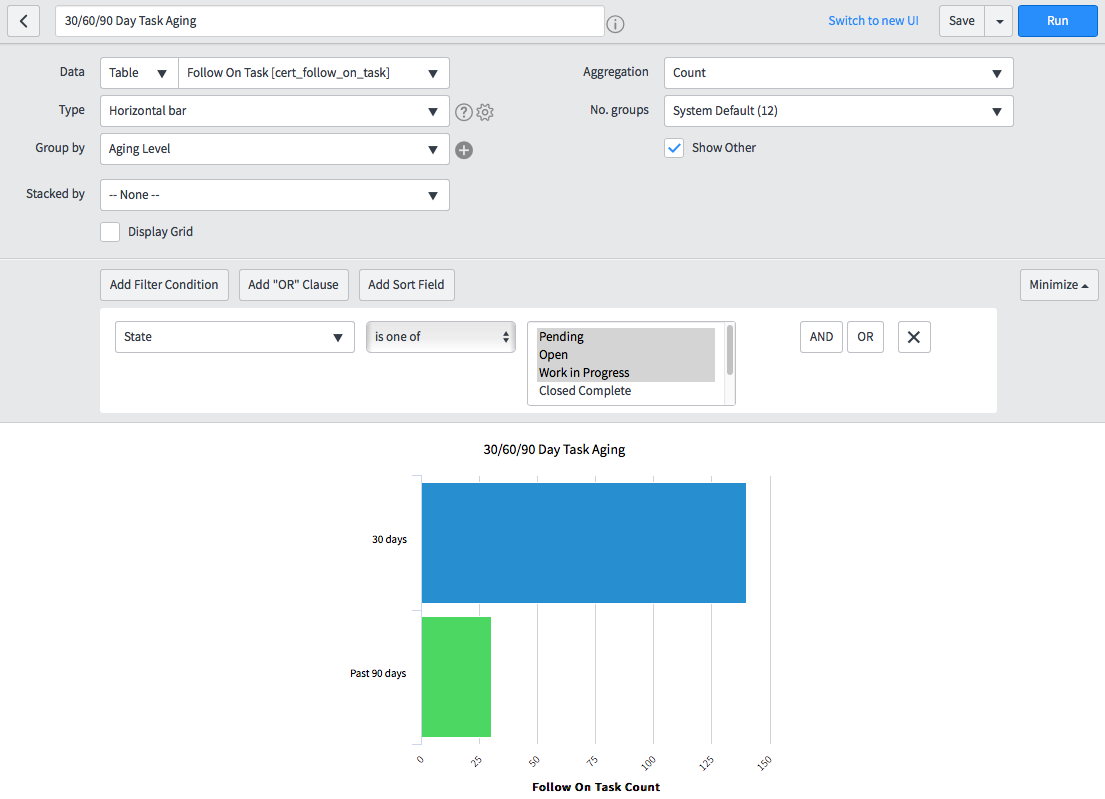
Source: ServiceNow product documentation
Let’s take a look at Report Designer and its tabs.
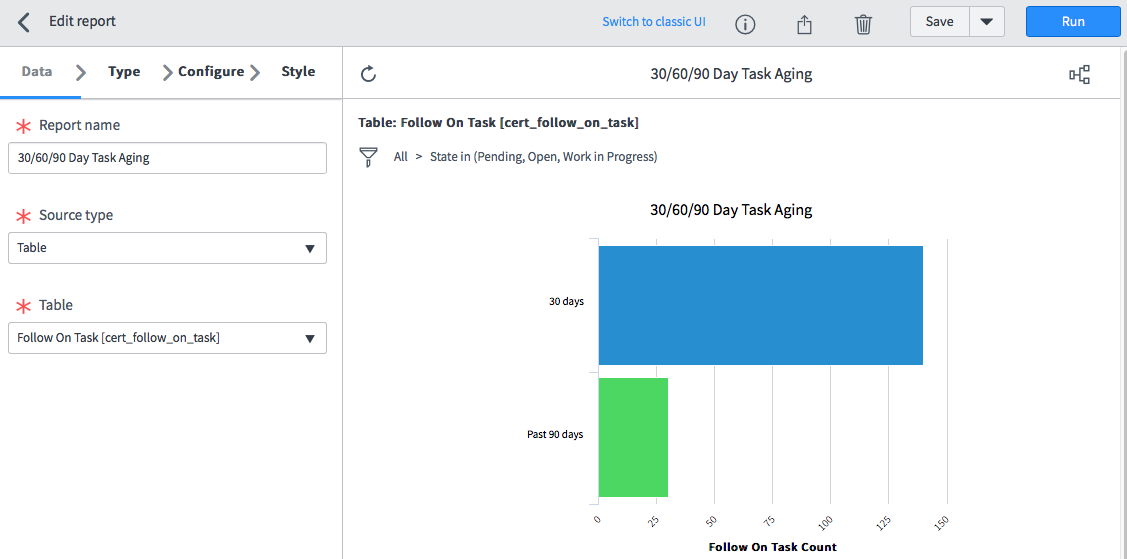
Source: ServiceNow product documentation
For example, you can get information about the team performance, IT support resource consumption, IT service delivery that helps you to build work more productively.
Let’s see in detail.
How to monitor IT service delivery?
Using ServiceNow, you can get clear visual information about different indicators, such as:
- mean and medium first response time;
- Service Level Agreements (SLA) that are not met most often;
- frequency of reopened incidents;
- number of service interruptions;
- time when certain IT services were unavailable;
- level of service availability and more.
With this information, the team lead can structure the work of the IT service department in the most efficient way.
How to track IT support resource consumption?
ServiceNow reporting can help the manager to control the budget and the costs. In this way, the most helpful are the reports on:
- the general costs of IT departments;
- the quantity of IT support teams which exceed the budget;
- the events that have caused an excess of the budget;
- the count of additional money spent.
How to explore team performance?
ServiceNow reporting can help you explore the progress of every team member and compare the performance of different employees. To find the roots of problems, you can analyze:
- the level of users’ satisfaction with the work of the IT department;
- the quantity of resolved and unresolved cases;
- successful and failed changes;
- the average first reply time;
- the downtime per employee;
- compliance or noncompliance with SLAs;
- repeated incidents per each member of the team;
- the Knowledge Base replenishment.
In this way, ServiceNow reporting can help you define and resolve weaknesses in the work of team members. ServiceNow allows for building a lot of reports, but sometimes its functionality may be difficult to master. In this case, it is better to turn to ServiceNow experts who can help you with setting Report Builder or Report Designer in your specific environment.
How convenient is ServiceNow reporting?
There are several arguments that confirm the convenience of ServiceNow reporting:
1. ServiceNow reporting is on the same platform with data that it uses.
2. ServiceNow has a lot of helpful built-in features for creating reports:
- several types of reports for visualization of different kinds of data (for example, pie, donut, bubble diagrams, lines, bar charts, maps and more).
- perfect detalization. For example, when you push one of the bars of a bar chart report, you see another report with more details.
- convenient filters for creating and searching reports.
3. ServiceNow shows data in real-time. Create a report with the needed settings and open it when it is necessary, your data will be actual.
4. ServiceNow allows for planning reports. The program can build reports and send them to users according to your rules and schedule.
How is data security achieved?
ServiceNow allows for managing user access. Admins can establish the users’ roles that make it possible to fulfill certain actions with reports: create, read, or edit. For example, users with ITIL roles can build reports and users without this role see only the reports shared with them. It increases the privacy of information.
What drawbacks does the ServiceNow reporting have?
Some aspects of ServiceNow make it harder to use, such as:
- Quality of data. Information for reports is provided manually by users, so any incorrect input can affect the quality and accuracy of reports.
- System overloading. If several large reports with a lot of drill-downs are opened at the same time, the risk of overloading increases.
- Requirements for knowing Jelly and JavaScript. Sometimes a manager should have special knowledge of Jelly and JavaScript to create complex reports.
- A difficult setting without professional help. For setting up the links between different indicators, it can be required to consult with an expert or use external reporting solutions.
ServiceNow reporting is a convenient and secure functionality that helps managers to get information about the IT team performance, IT support resource consumption, IT service delivery, and other important indicators. The manager can use out-of-the-box reports or create custom ones with the help of Report Builder or Report Designer.