


Audience analytics is needed for correcting an advertising campaign and an app itself so you could get maximum income from your product in any conditions (even changing ones). Analytics should cover all the stages of conversion way. The main task of a mobile marketing specialist is to understand all the important aspects of interaction with an app and know the effect of advertising.
Basic indices
- Quantity of installs and registrations
Not all the users who installed an app become loyal users. Some don’t pass a registration stage right after the launch. That’s why a number of registrations is always fewer than the number of installs. A good index is 60-80% of registrations but it largely depends on the app theme. Besides, there may be more installs than registrations due to a fact that some users are already registered in the app and download it for another device. You can track it with the help of Game Cente and authorizations via social networks.
- Active audience
It’s the number of active users who visit an app during a definite period. There’s daily (DAU), weekly (WAU), and monthly (MAU) audience.
- Session length
This parameter displays an average quantity of time each user spends in an app during one session. It’s not valuable on its own but it allows you to segment users by the time they interact with your app.
- Income
A marketing specialist should understand how much income do users bring. ARPU index is used for this — an average income from each user. But a business model often doesn’t imply that all the users make transactions, for example, in a case with a free-to-play scheme. That’s why an average income is often calculated for a category of paying users — ARPPU (an average income from each paying user).
- Involvement in a dialogue
This metric displays the percent of opening letters and push-notifications by users. You should be aware of how users react to your tries to get them back to an app.
Budget
It’s important to know how much does one install cost. There’s a special metric for it — eCPI (efficient install cost). You need to divide CPI by virality coefficient in order to calculate it. You can calculate virality this way:
eCPI should be lower than CPI.
LTV (lifetime value) is another important metric. It displays an income from each user for all the time he/she uses an app. LTV is calculated by a simple formula:

Expenses mean all the expenditures: from app development to purchasing advertisements. It’s important to understand that the LTV index should be higher than eCPI. I.e. expenses on advertising should be less than an income from each user. Good recoupment of advertising is when LTV exceeds eCPI by 2-3 times.
You can increase LTV and decrease eCPI with the help of precise targeting. But only practice will help here. It’s necessary to make test selections and choose a more beneficial audience on their bases. Besides, it’s important to push each user to larger expenses in an app.
Interest
Keeping users is an important task for a marketing specialist. Retention Rate is a special metric for this. It shows the percent of users who left an app sometime later. Retention Rate is usually calculated by days during the first week and then — by weeks. It’s good when the index stays at the level of 15-20%. An acceptable index is from 10% and higher.
There are 2 other metrics that cover the process of the organic spread of an app. It’s virality and the word of mouth.
You can calculate the first index like this:
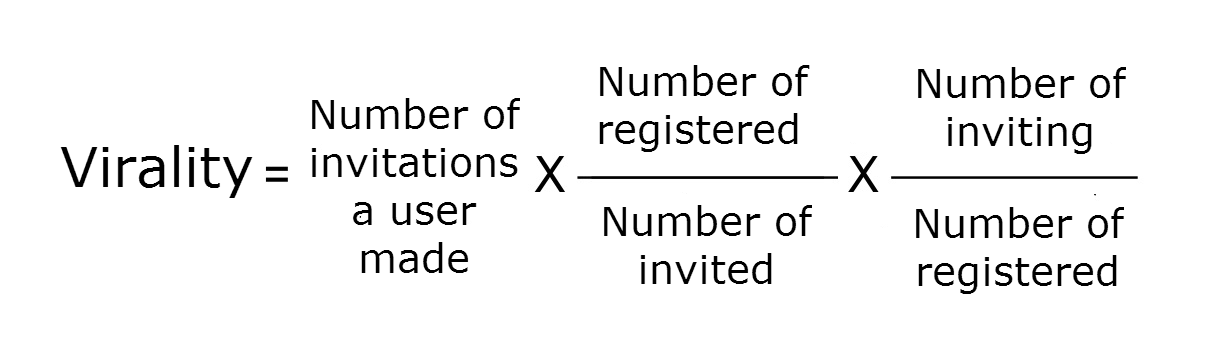
In practice it looks the following way:
- at first, count how many invites on average does a user send to friends, let it be 20.
- then count how many people accept the invites, for example, 10 out of 100, i.e. correlation is 0,1.
- 6 out of 10 registered users will invite others, correlation is 0,6.
- further on we multiply 20 by 0,1 and by 0,6. We get 1,2. That’s a virality coefficient.
Virality more than 1 is a good result.
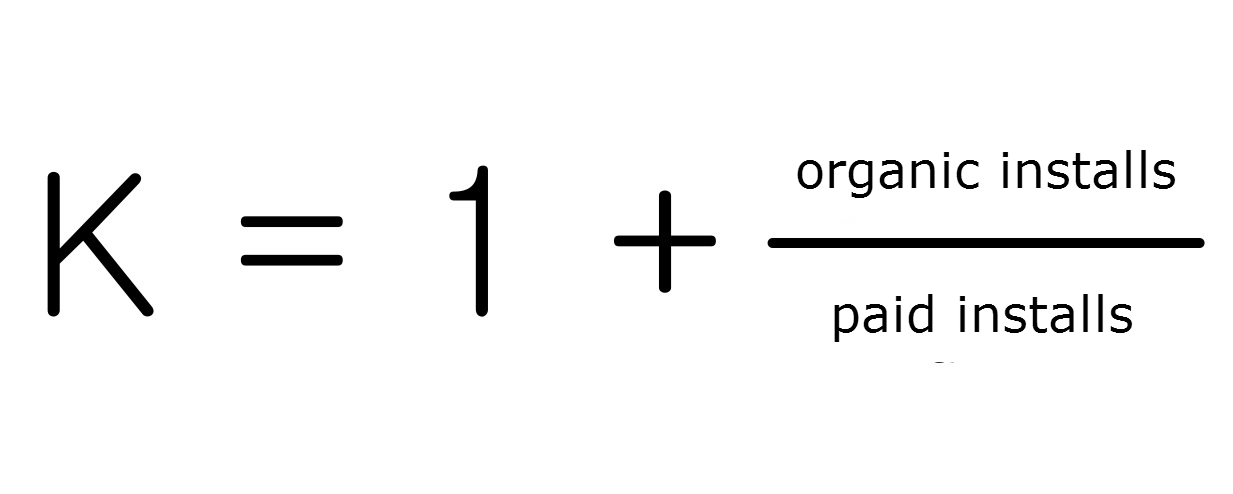
Another metric is “word of mouth”:

You can see the number of users who came by invitations of other users as a result. You can make a correction by Churn Rate and virality for a more precise index of the metric. A deeper analysis includes user segmentation by activity and loyalty.
Different tricks are used in an app for virality increase. Everything depends on the theme and idea of your product. Besides, you should take into account the “age” of your users. Stimulate to invitations friends of those people who are in the beginning or in the middle of a life cycle in an app. The ones whose LT is getting closer to the end won’t have enough time to bring you profit.
Loyalty
Loyalty is one of the main indices in audience evaluation. There are several metrics that help to describe it.
- An index of users who left, Churn Rate, demonstrates what percent of users do you lose monthly. It’s a correlation of users who left for a monthly active audience.
- A metric of users who have returned, Return Rate, is a correlation of users who have come back to the monthly audience.
The 2 indices shouldn’t differ a lot. But Churn Rate is always bigger than Return Rate.
- LT (lifetime) — user lifetime. It’s calculated by the following formula: LT = 1 / Churn Rate.
There are many reasons why users leave: technical bugs, an abundance of advertisements, insufficiently considered an interface. For example, Churn Rate in social networks may increase because of the small audience.
Return Rate may be increased by retargeting and tools for getting a similar audience, for example, Facebook Lookalike. It’s significantly cheaper than attracting a new audience.
We’ve discussed the main metrics that any mobile marketing specialist should use. You can track advertising efficiency and the level of app optimization. A wise analysis of the indices allows you to find problems in-app mechanics and advertising campaigns.
Read more about mobile app promotion
- Part 1 Choosing a niche
- Part 2 Typical strategies
- Part 3 App Store and Google Play rules
- Part 4 Choosing app name
- Part 5 Screenshots and app description
- Part 6 App icons
- Part 7 Making up a marketing plan
- Part 8 Creation of a landing page
- Part 9 Preparing banners
- Part 10 App localization
- Part 11 App monetization: banner advertising
- Part 12 Incent traffic
- Part 13 Featuring
- Part 14 Review of app business-models
- Part 15 TOP algorithms
- Part 16 Video on the app page
- Part 17 Promotion in mass media
- Part 18 Alternative stores
- Part 19 Reviews and ratings in the stores
- Part 20 Analysing competitors
- Part 21 Viral mechanics in app promotion
- Part 22 Soft launch
- Part 23 Selling triggers
- Part 24 App design A/B-testing
- Part 25 App of the Day
- Part 26 Retargeting
- Part 27 Promotion in social network communities
- Part 28 App tutorial
- Part 29 App authorization forms
- Part 30 Mobile advertising in video networks
- Part 31 How do trackers work?
- Part 33 Search in app stores
- Part 34 Pre-installations
- Part 35 Push-notifications