


We’ve translated a review of key mobile app metrics for you. If someone asks you what’s the difference between ARPU and ARPPU or Lifetime and Lifetime Value, just give them a link to this article.
As a rule, apps are created with one simple goal — to earn some money. Nobody will give you money for no reason. So in order to earn it, you’ll have to try hard and go through many stages.
How do most of the apps work:
- People download an app from an app store to their mobile device and open it (here we start to use the word “user” instead of “person”).
- If they like the app, users will periodically use it. If not, then, correspondingly, they won’t use it and will delete it from the device.
- If users really like an app, they use it again and again and some especially loyal ones will make purchases in the app, bringing joy both to themselves and the developer.
There are metrics on each step that help to understand how successfully does your app work and what feedback do your users give by their behavior. All the metrics we will talk about are available by SDK integration from devtodev.
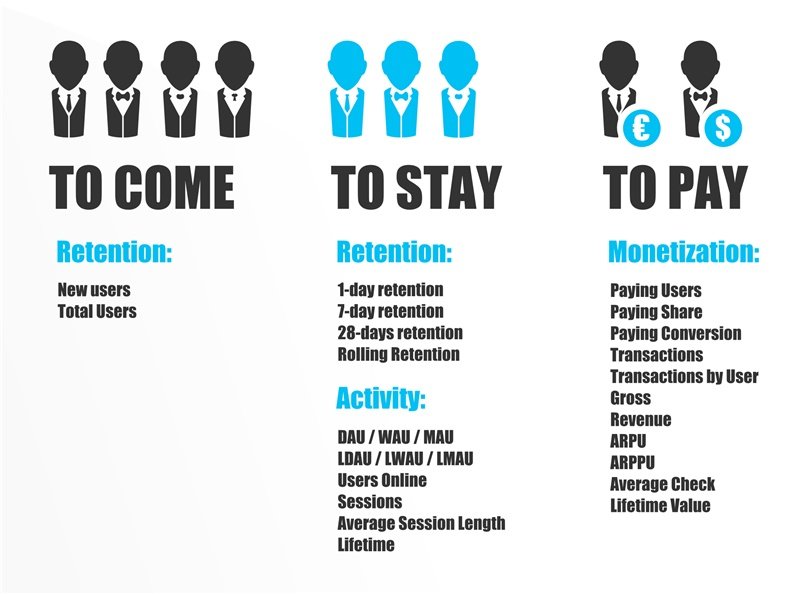
Attracting users
So users have installed an app and launched it once. A person turns into a user when he/she opens an app for the first time. All the people who opened an app on a definite day become New Users from the day. How many new users should there be? The more, the better, surely. But everything depends on your project. The most important thing is that the number of new users should cover the flow-out from the project, then your project will continue to grow. You can increase the number of new users due to carrying out advertising campaigns or the introduction of viral mechanisms into your project so that existing users could bring new ones.
There will be more and more new users with some time and you’ll wonder how many users have tried your app. Total Users metric shows how many users are there in your base for the chosen date.
Keeping users
Users who have just opened your app for the first time, are trying it and some will like it while others won’t. If a user doesn’t like the app, he/she will probably leave it and won’t come back.
If a user returns to an app on the following day after he/she opened it for the first time, it means that the app has impressed him/her. Percent of users who have come back on the following day after the first visit is called 1-day retention. It’s necessary to track this metric in dynamics and to enhance it constantly as there’s no limit to perfection. If a user doesn’t come back the next day, it means that there’s something he/she doesn’t like and it’s likely an interface. Try to change it for new users (add or change tutorial, make prompts telling a beginner-user about advantages of your app). If you’ve done everything correctly, 1-day retention will react and increase on the following day. Users are expensive and difficult to get and it’s wrong to lose them the next day so always optimize these metrics.
Percent of users who have returned in 7 days since the first visit is called 7-day retention. And finally, if users come back in 28 days since the first visit, it’s called 28-days retention. And it’s serious. You may reckon that your app has really interested users and they are loyal to you even in 28 days.
Ideally, all the 3 retention metrics should be 100% (a user stays with you in 1/7/28 days). But it’s hardly achieved. Think of what a user faces during the first week/month. What may make him/her leave? Then optimize these narrow places. User segments, events, and funnels will help you. All the tools will help to identify the places where a user decides to leave.
There is a Rolling Retention metric which helps to calculate retention for other time periods (not only for 1/7/28 days). It shows how many users (in percent), who have opened an app for the first time in the period of time you’ve chosen, are still active (here active users are those who have opened an app at least once during the last 7 days). The index raises as it gets closer to the present day. It’s likely that on the Rolling Retention graph you’ll find leaps (higher user percent who are still active) and then you’ll have to learn with each of them. They may be determined by different reasons: advertising campaign setups or simple seasonality. We, in particular, faced a situation when users who came on Friday were a little bit more loyal as they have more free time to explore an app during a weekend.
User activity metrics
So your app works and there are new users in it and the audience is growing. The quantity of unique users who visited your app on a definite day is called DAU (Daily Active Users) of the day.
The quantity of unique users who came to your app during a week is called WAU (Weekly Active Users). Pay your attention to the fact that WAU is not a sum of DAU for 7 days, it’s unique users only, who visited your app for a week. One and the same user may come to an app every day during a week and then he/she will increase each day DAU by 1, though WAU will also increase by 1 as repeated visits don’t count.
MAU (Monthly Active Users) metric is calculated the same way – a number of unique players who have visited an app during a month.
DAU, WAU, MAU metrics define the scale of your project. While making partner agreements, these are the things you’ll be asked at first. Surely, they will grow with some time. In order to provide their growth, you need to maximize the flow of new users and retention.
It will also be interesting to calculate correlation, for example, DAU to MAU. Sometimes this index is called Sticky Factor as it tells about user entry regularity. Let’s assume there are 1000 users in a project and each of them visits an app once a day, then DAU and MAU are 1000 and Sticky Factor equals 100%. If each user enters an app only once a month, then Sticky Factor will be 3,3%. The higher is the metric, the more regularly users enter your app.
It happens quite often that DAU, WAU, and MAU indices fluctuate a lot because of unstable new user flow. In order not to take them into account, LDAU (Loyal Daily Active Users), LWAU, and LDAU metrics were developed.
LDAU is a number of unique loyal users who launched an app on a definite day. A loyal user is a user who launched an app at least once since the first visit. LWAU and LMAU are calculated in a similar way.
It turns out that the closer is DAU and LDAU indices to each other, the less is there so-called “one-day-users” in the app. Correspondingly, the closers are DAU and LDAU, the higher is 1-day retention.
Sometimes you may need to know how many users are there in an app right now. Users Online evaluate the quantity of simultaneously playing users on a definite moment and it renews every 5 minutes. Such a metric is especially relevant for online games where interest for a game depends directly on the simultaneously playing users.
Pay attention to maximum Users Online during a day. Firstly, it will show you the maximum load for your servers. Secondly, it will allow you to define the optimal time when there is the maximum number of users in an app (for, example sending of push-notifications). Thirdly, it’s a popular metric for comparing scales of several apps.
Each user visit is called a session and the Session metric shows how many sessions there were in an app for a definite period of time.
If we divide a total session duration by their quantity, we’ll get the Average Session Length index (an average length of a session). It’s wrong to say that long sessions are good and short ones are bad. In apps for booking a taxi, short ones are good: you need only to book a car and the shorter are the sessions, the more convenient is the service. But longer sessions are good for apps for reading.
Lifetime metric shows how many days on average a user uses your app from the first till the last entry. It’s recommended to use this metric for narrow segments: for paying and non-paying users, for users who have reached a definite level. In this case, you’ll know the most probable lifetime periods for players of each segment and will be able to offer a user something interesting at the right time: a push-notification, discounts or special offers, gifts, new tasks, etc. Besides, a lifetime metric may be used for planning some regular events in your project. If you know how much time on average a user spends in your project, you can set up the events in such a way that they will be new for the majority of users.
You should increase your lifetime: the more time a user stays with you, the higher is the level of his/her loyalty and the more is the possibility of a purchase. Regular (daily/monthly) tasks in online games are a great way to increase a lifetime.
Monetization metrics
So users decide to make an in-app purchase. Paying Users metric displays the number of unique paying users per day.
Paying Share metric shows what percent of all the unique users, active during a period of time, have made purchases. Ideally, each user should be a paying one, and Paying Share is 100%. But in reality, the index is significantly lower and growth by 1% is a great achievement for a project.

You can increase the share of paying users by adding new content for purchasing, changing the prices, or making discounts.
Paying Conversion metric shows what is the percent of paying users among those who registered in a definite period. As in the case with Rolling Retention, try to find the jumps in this metric behavior. It’s quite possible that it will indicate some conditions when the percent of paying users is maximum (advertising, banner networks, etc.).
Each user payment is a separate transaction in a base. And one user can make several transactions during a period of time.
The total transaction quantity is displayed in the Transaction metric. Transactions by User metric shows how many transactions on average have one paying user made during a definite period of time. If none of the users made repeated purchases, Transactions by User will be 1.
Recurring payments are the main part of income in free-to-play games. Firstly, they have a big size. Secondly, there’s a big possibility that after the second payment, the third one will follow.
The total sum of all the gamer payments is displayed in the Gross metric. But a developer won’t get the whole sum of money: an app store gets some commission. As a rule, the commission is 30%, so, correspondingly, 70% from Gross goes to a developer and is shown in the Revenue metric. If the commission isn’t 30%, you can easily change it in devtodev setup.
So you’ve decided to create your app for the sake of the Revenue index.
ARPU (Average Revenue Per User) index is important as well. It’s a sum of payments for a period of time (Gross) divided by the number of unique users for that period of time (DAU, MAU, WAU). ARPU tells you how much money does a user brings on average. But it takes into account both paying and non-paying gamers. ARPU suits perfectly for evaluation business efficiency and comparing of several projects.
It’s useful to consider the ARPU index as a whole (to compare the efficiency of several projects) and separately for each user segment. In particular, you can calculate ARPU for new users and ARPU for the “core”. New user ARPU will be significantly lower but in comparison with “core” ARPU you’ll see how it’s important that new users should transfer to the “core”.
Compare ARPU for users from different levels, periods of time from the first entry. As a rule, the longer is a user in a project and the higher is the level, the more is ARPU.
ARPPU (Average Revenue Per Paying User) metric is calculated as a sum of payments for a period of time (Gross) divided by the number of unique paying gamers (Paying Users). ARPPU shows the price level in an app and how paying users react to them, how much money are they ready to spend during a period of time.
If each gamer is paying, ARPPU equals ARPU.
In order to increase ARPPU, it’s enough to increase the prices in the project. Only the most solvent users will continue to pay but ARPU (which is more important for the evaluation of business efficiency) risks to drop.
That’s why you should make all the actions on changing project monetization in such a way so both ARPU and ARPPU would raise. Adding new interesting content works great for this goal in online games: more users start to pay, those who already paid, pay more in order to get appealing armory. As a result, Paying Share, ARPU, and ARPPU grow.
There’s also the Average Check metric which is calculated as Gross divided by the quantity of the payments – Transactions. The metrics are similar to ARPPU. Though, ARPPU, unlike Average Check, doesn’t take into account recurring payments from one and the same paying user. If we assume that each paying user pays only once, then ARPPU equals Average Check.
And finally the last but not the least metric – Lifetime Value (LTV). It shows how much money does a use brings during the time he/she uses an app. As for LTV, they write an article about is as it’s really one of the most important metrics which shows an app efficiency. It combines both the period of user activity and the payments.
Lifetime Value is used for evaluating the price of attracting a new client. The rule is simple: Lifetime Value should be more than the price of a client attraction. Otherwise, the business is inefficient.
In order to maximize LTV, you need to understand that Lifetime Value is both Lifetime and Value (ARPU in this case). In other words, the longer a user stays with you and the higher is average income, the higher is LTV. A user should like the project, then a lifetime, ARPU, and LTV will increase.
Track the changes of the metric, learn the reasons, indicate factors that maximize LTV, and plan changes in your projects due to all the above mentioned.
It’s also useful to look at LTV of different user segments: country or language, a period of time since registration.
So we have examined all the app key metrics. Honestly speaking, they will suit not only mobile apps but online games, online stores, etc. Track the indices dynamics, learn reasons for changes, find out and apply the most efficient factors. We recommend making a fully detailed analysis. The main metrics: ARPU, lifetime, retention, etc. help you to understand the whole condition of the project. In order to understand their behavior, a detailed analysis is needed. It’s convenient to apply user segments. You’ll be able to see each metric separately for each user segment.
Have a high ARPU and long Lifetime!
Task
Now in order to check whether you’ve understood all the material, here’s a task for you.
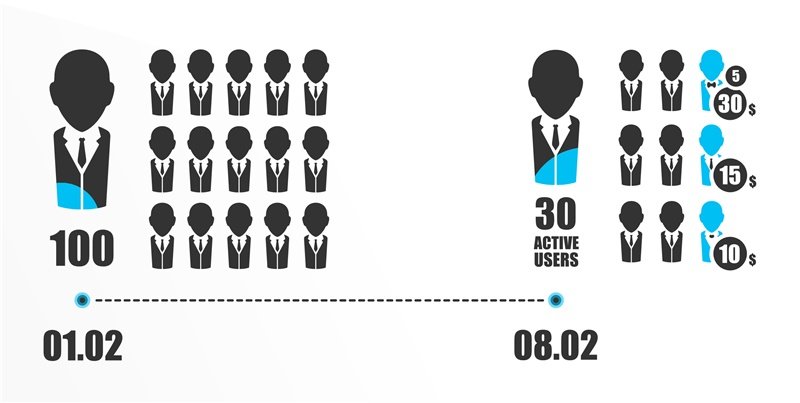
110 people downloaded an app “Test app” on February, 1. 100 of them opened it. We assume that users didn’t download and open the app on other days.
There are 30 unique active users in the app in a week, February, 8. 3 users made purchases that day: A user paid $10, B user paid $15, C user paid $30 and later on, he paid $5.
Calculate the following metrics:
- 7-day retention.
- DAU 08.02.
- Paying Share from 01.02. till 08.02.
- Paying Share 08.02.
- Paying Conversion 01.02.
- Gross 08.02.
- ARPU 08.02.
- ARPPU 08.02.
- Average Check 08.02.