


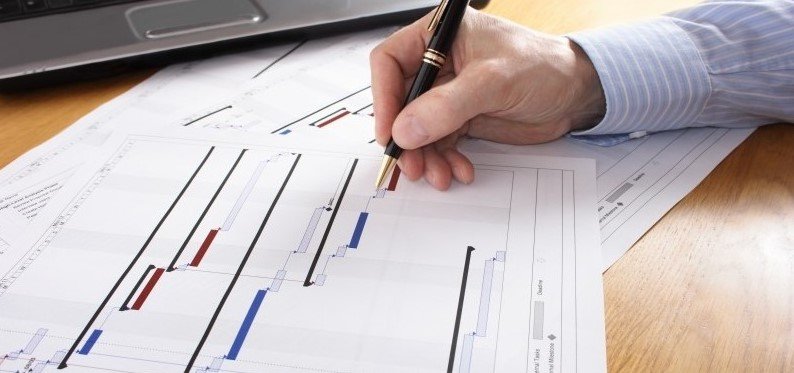
Millions of project managers all over the world visualize their tasks and track projects every day to succeed in their businesses. One of the most powerful tools they use is an easy-to-implement Gantt chart.
There was a time when they created such bar charts by hand with the help of a whiteboard, but smart online project management software has simplified that need.
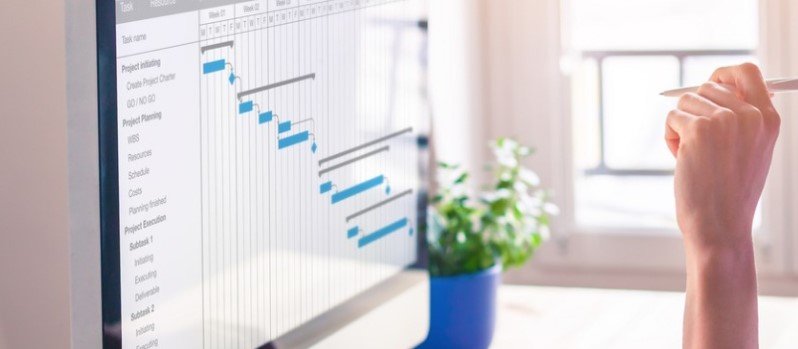
Technologies have changed the Gantt charts somehow, but their core concept has stayed firm. A modern Gantt chart is a popular way to visualize how your individual tasks are progressing.
Gantt chart definition
A Gantt chart is a horizontal bar chart created as a production control tool. The author of these charts concept, an American engineer Henry L. Gantt introduced his tool in 1917. Today Gantt charts are frequently used in project management, they provide teams with a graphical illustration of schedules, help to plan, coordinate, and track project tasks.
Gantt charts advantages
Gantt charts as a powerful addition to your task management tool, demonstrate where your tasks intersect and change.
Applying online Gantt charts, you will be able to:
- visualize linked tasks, dependencies, and due dates
- visualize the amount of time it takes to finish each tasks
- track who is assigned to each part of your project
- see potential roadblocks and issues that need to be addressed
- control parts of the project that are falling behind or risky
- Identify the critical path
- track alternatives and find workarounds
Who uses Gantt charts
Today, Gantt charts are available for everyone and help visualize their tasks. Anyone can create a simple task list, add start and end dates, and software algorithms will do all the rest difficult work.
You’ll definitely use Gantt Charts if you are:
- project manager
- operations manager
- team leader
- general manager
- scheduling manager
- marketing manager
- CEO or CTO
- … anyone who wants an instant view of a project timeline.
Best Gantt charts software
If you are looking for a Gantt chart functionality, pay attention not only to managing projects. You will also need tasks and project hierarchy, commenting, sharing and more options to run your masterpiece projects. Here are the top-5 tools that may assist:
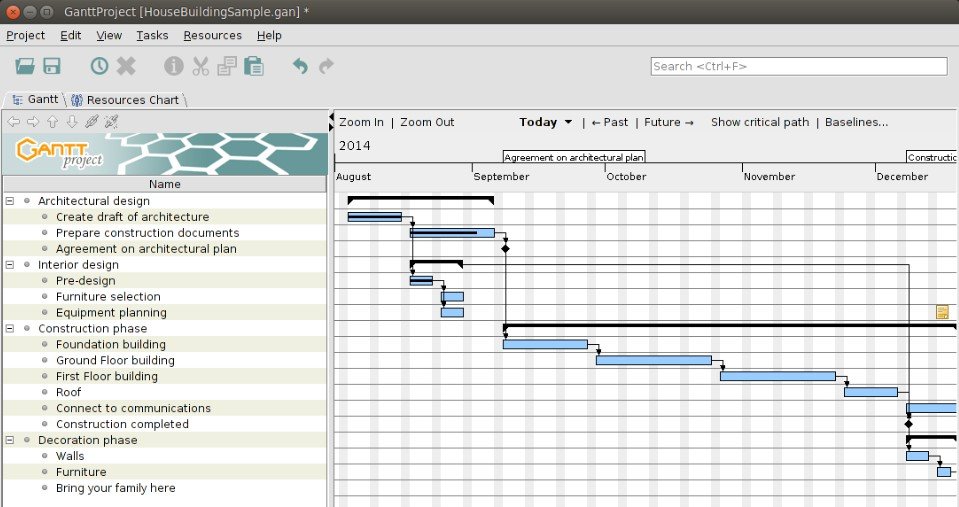
GanttProject is a free Gantt chart tool that provides simple tools for sketching dependencies and timelines. There is a basic wireframe-type design that can be quickly installed for creating beautiful Gantt diagrams.
Though it is not a full-fledged PM software, you can easily add it to your current project management system.
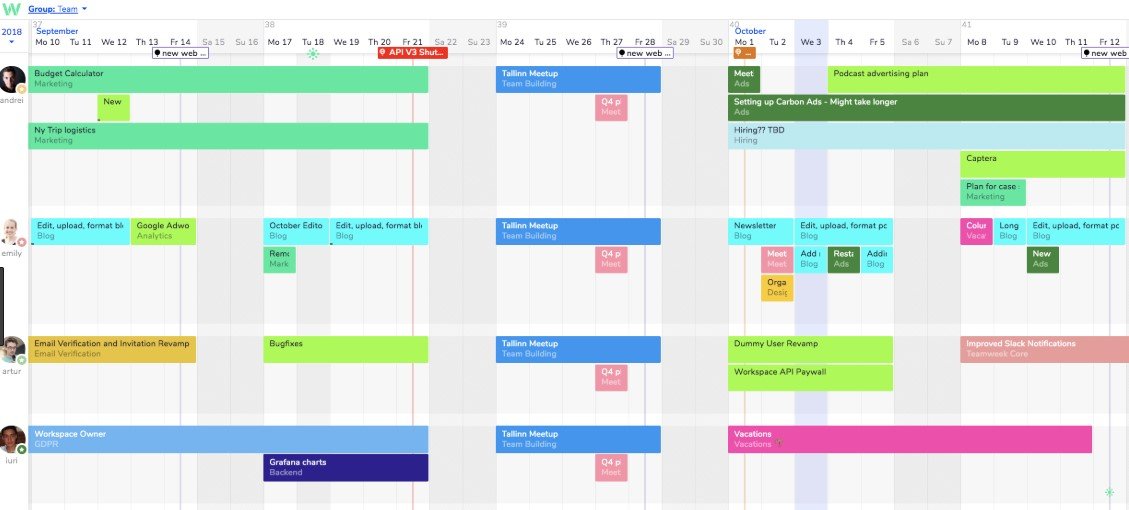
Teamweek provides great Gantt chart functionality, which teams up to 5 can use for free.
The timelines by Teamweek are more of a calendar and project planner. They demonstrate to you where tasks occur on the timeline and how they overlap.
There is a public link for the Teamweek charts, so it is possible to share them with other people even if they do not have an account on Teamweek.
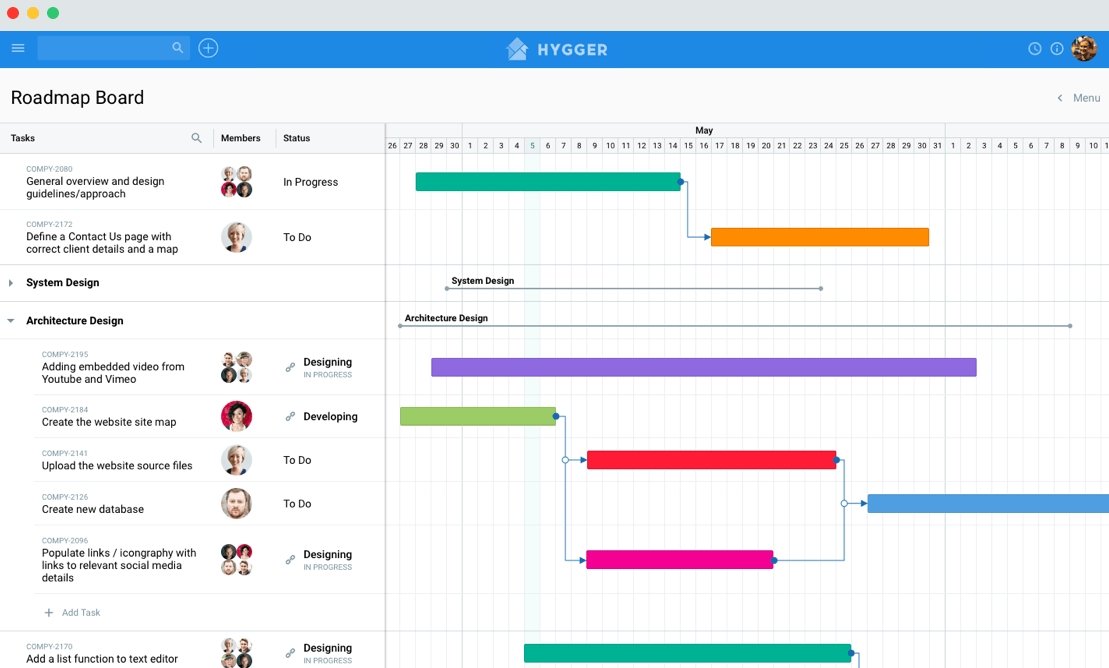
Hygger also offers stunning visual planning tools including smart timelines based on Gantt charts.
The Hygger timeline feature is designed to provide you with a convenient way to manage simple and complex projects. You may be sure – you will not lose track of project progress or miss important deadlines.
Using a colorful timeline, you are able to create project start dates and drag and drop tasks to update start and end dates for your project activities. The platform helps to spot potential bottlenecks that can cause operational inefficiencies.
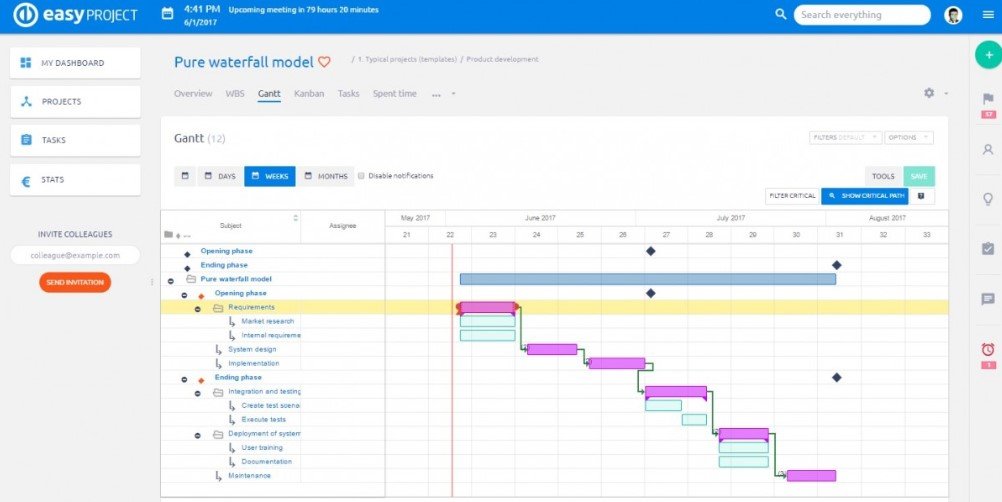
Easy Project is a project management tool used by teams of all sizes to collaborate all together.
The developers offer that their tool is able to replace the mess of emails, spreadsheets, and whiteboards.
Easy Projects is rather easy to use, it’s Gantt chart tool helps not only in visualizing team progress but also in managing and delegating work.
It will empower you if you want to modify project schedules, add or change dependencies, view critical path, track project and task progress and much more.
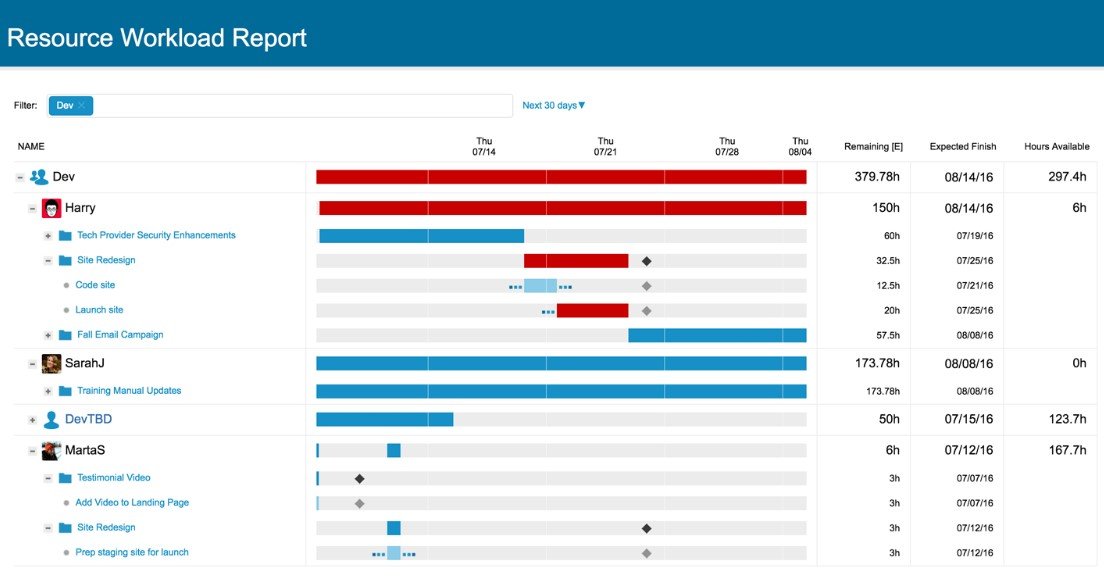
Liquid Planner is focused on task prioritization but its resource leveling and resource scheduling are not only great for small teams but also serve large corporations’ needs.
The platform proposes to use an elegant interface that makes it easier to track and manage all your projects.
The predictive scheduling in Liquid Planner is a predictive algorithm with a scheduling system that automatically predicts resource availability and the time it will take for tasks to complete.
Takeaways
The best way to get convenient using a Gantt chart is to create one.
A Gantt diagram is helpful as it shows dependencies and where work may overlap, assisting your team to prioritize tasks and work.
Use powerful software with Gantt charts to create a project and play around with it. The more Gantt charts you use, the more confident you’ll get at using them.